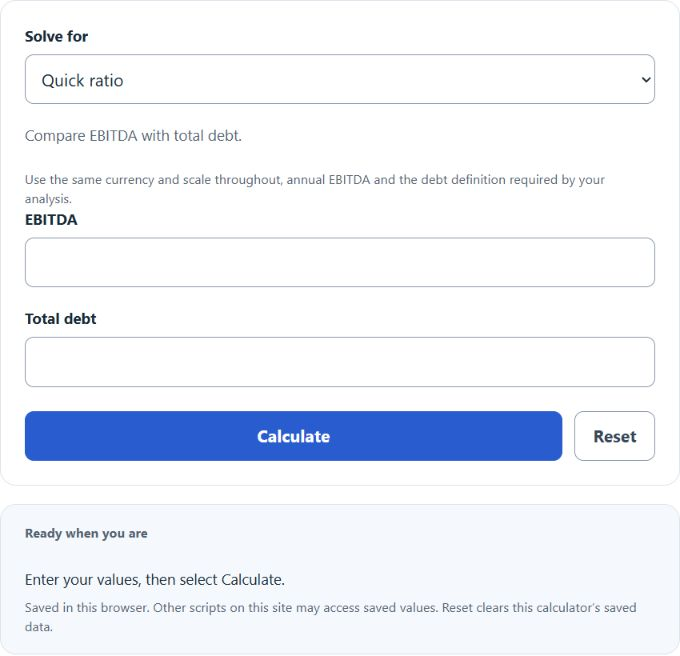
Calculate the EBITDA-to-debt ratio and debt-to-EBITDA multiple, or build EBITDA from net income, interest, taxes, depreciation and amortization.
EBITDA to Debt Ratio Formula
The inverse, which is more commonly cited by lenders and analysts:
If you do not have EBITDA directly, build it from the income statement:
- EBITDA: earnings before interest, taxes, depreciation, and amortization
- Total Debt: short-term plus long-term interest-bearing debt
- Net Income: bottom-line profit for the period
- Interest: interest expense for the period
- Taxes: income tax expense for the period
- Depreciation and Amortization: non-cash charges from the cash flow statement
Use trailing twelve-month EBITDA against the most recent debt balance, and keep currency and scale (millions, thousands) consistent across every input. Operating leases and pension shortfalls are sometimes added to debt in stricter analyses.
Reference Tables
The first table provides illustrative comparison bands, not universal lender thresholds or credit ratings. Industry, cash flow, debt terms and covenant definitions matter. The second table expresses reciprocal ratios for positive EBITDA and debt; EBITDA is not cash flow.
| Debt / EBITDA | Read | Illustrative context |
|---|---|---|
| Below 2.0x | Low | Conservative balance sheet |
| 2.0x to 3.0x | Moderate | Compare with sector peers and terms |
| 3.0x to 4.0x | Elevated | Watch covenants and rate sensitivity |
| 4.0x to 6.0x | High | Review repayment capacity and covenants |
| Above 6.0x | Stressed | Review liquidity and refinancing exposure |
| EBITDA / Debt | Equivalent multiple | Interpretation |
|---|---|---|
| 50% or higher | ≤ 2.0x debt | Higher EBITDA per unit of debt |
| 33⅓% to 50% | 2.0x to 3.0x | Average |
| 25% to 33⅓% | 3.0x to 4.0x | Tight |
| Below 25% | Above 4.0x | Highly leveraged |
Example and FAQ
Example. A company reports net income of 8, interest of 1.2, taxes of 2, and D&A of 3.5 (all in millions). EBITDA is 8 + 1.2 + 2 + 3.5 = 14.7. With total debt of 50, Debt-to-EBITDA is 50 / 14.7 = 3.40x and EBITDA-to-Debt is 14.7 / 50 = 29.4%. That falls in the illustrative 3x to below 4x comparison band.
Should I use gross or net debt? Use the debt definition specified by your credit agreement or analysis. Net debt subtracts the defined cash balance from gross debt and may produce a lower multiple; this calculator uses the entered total debt.
Why is my ratio “not meaningful”? When EBITDA is zero or negative, the multiple does not describe leverage in the usual way. Look at interest coverage and cash flow instead.
What counts as total debt? Bank loans, bonds, notes, current portion of long-term debt, and finance lease liabilities. Trade payables are not debt.
Is a higher EBITDA-to-debt ratio better? With positive EBITDA and debt, a higher ratio means more annual EBITDA per unit of debt. It does not by itself establish stronger cash flow or repayment capacity.